


Bubble chart
ScatterChart plotting accounts by usage score, monthly revenue, and seat count encoded as bubble size.
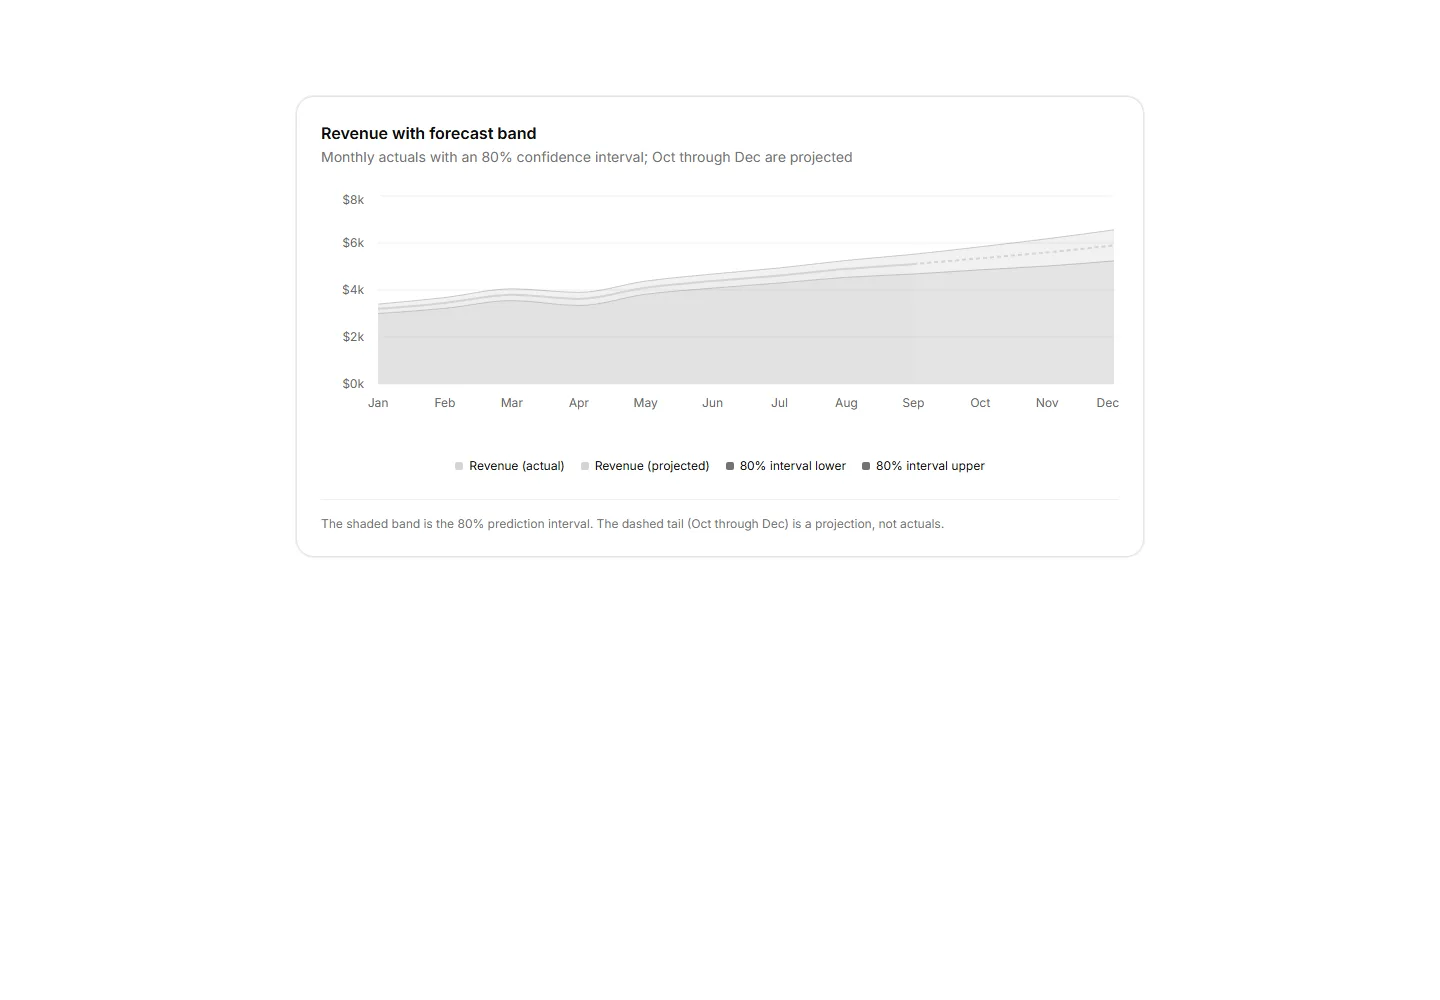
An area chart showing actuals with a muted 80% confidence band and a dashed projection tail for future months.
ScatterChart plotting accounts by usage score, monthly revenue, and seat count encoded as bubble size.
A card panel of five quarterly KPIs as bullet rows, each with qualitative range bands, a quarter to date measure bar, a target tick, and a shared axis.
A CSS grid heatmap of weekly cohort retention shaded by foreground opacity tokens with no chart library.
The funnel as horizontal bars with each rate against the prior stage, labeled.
Likert survey responses as diverging stacked bars around a center axis with a four segment legend and agree share per question.
Dumbbell rows comparing p95 latency per endpoint before and after a release, with connector bars, paired dots, and an axis row.
A radial gauge showing a single SLA percentage with the value centred and the target threshold named in the footnote.
Feature usage grouped bar chart comparing this billing period against the previous across six categories with a shared legend.
CSS grid calendar heatmap shading daily activity by foreground opacity across a six month window.
A card panel charting API response times bucketed into 100 ms bins as a single distribution, with a p95 callout and a dashed reference line.
Horizontal bar chart ranking the top 6 pages by view count with inline value labels and a footnote naming the 3x lead of the top page.
API request latency as p50, p95, and p99 lines over 24 hourly points with ms axis formatting.


