


MRR stacked bars
MRR movement as stacked bars with new and expansion above zero and contraction and churn below, last 6 months.
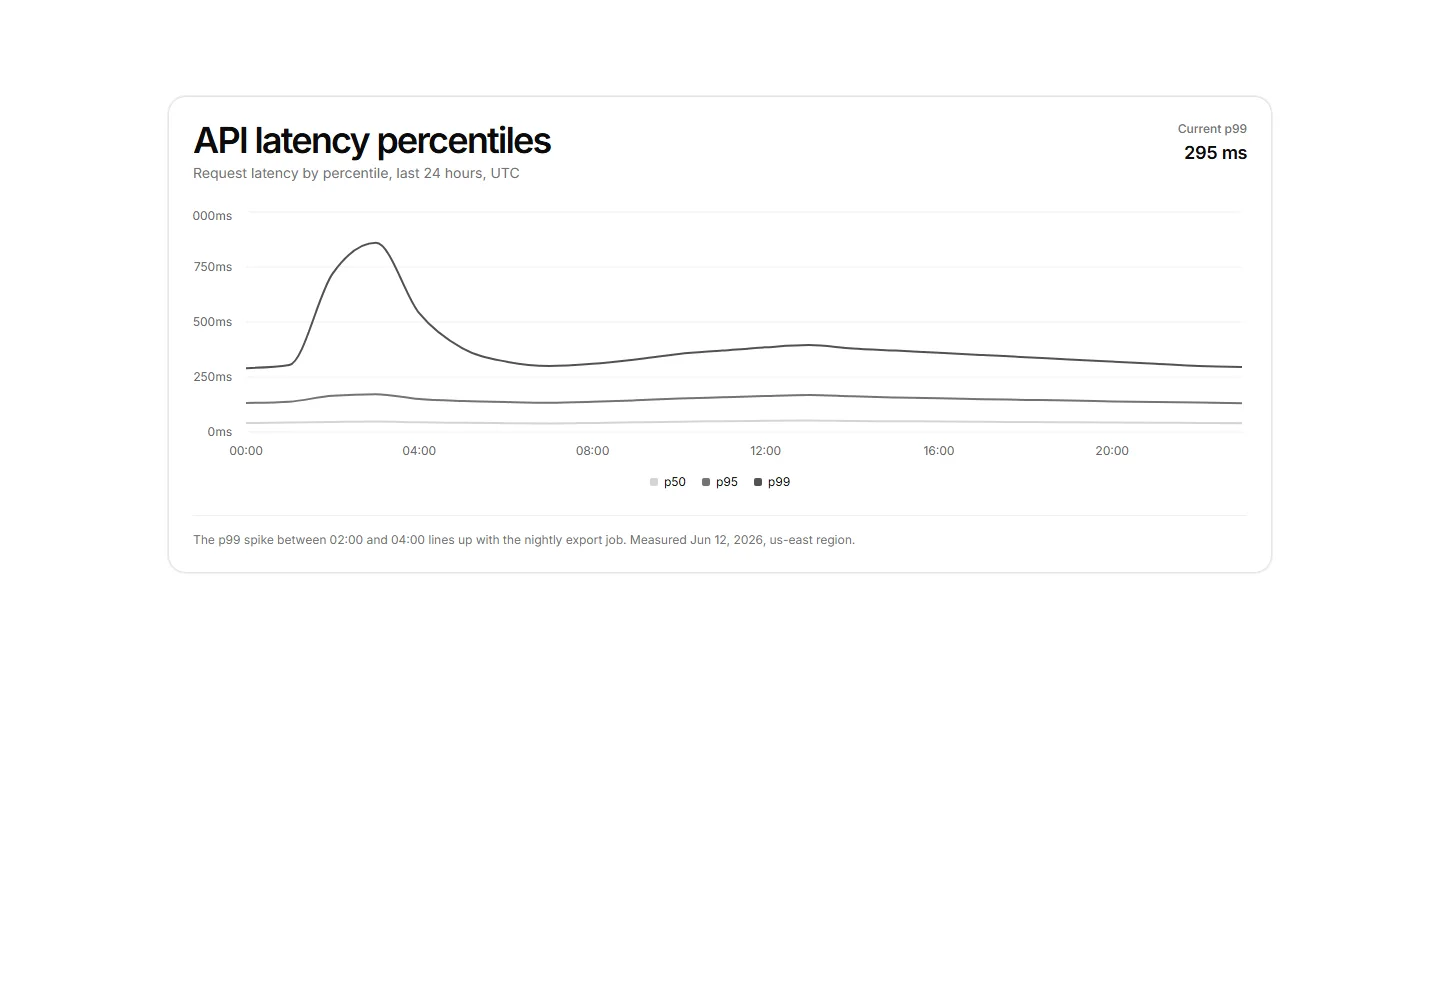
API request latency as p50, p95, and p99 lines over 24 hourly points with ms axis formatting.
MRR movement as stacked bars with new and expansion above zero and contraction and churn below, last 6 months.
Three-series line chart tracking monthly active seats across Starter, Growth, and Enterprise plans with a legend and a footnote naming the September crossover.
A Pareto chart pairing error category bars sorted by volume with a cumulative share line on a second percentage axis.
A card panel charting monthly signups by acquisition channel as bars normalized to 100 percent, so the chart reads as share of mix over volume.
Donut chart of active workspaces by plan tier with a center total label and a four plan legend.
RadarChart comparing two plans across five feature dimensions with filled polygons and a shared legend.
Concentric radial rings showing percent of quota used per storage resource beside a breakdown list with exact allocations.
Stacked area chart showing new business and expansion MRR added each month across an 8 month window.
Accounts scatter chart plotting monthly API usage against revenue with reference-line quadrants to surface expansion targets.
Weekly new account signups as a single series bar chart over 10 weeks with a labeled launch spike.
A card panel joining average active seats per plan across two quarters with slope lines between paired axes, the biggest mover drawn in full ink.
Four compact metric tiles each with a label, headline value, and a mini 8-week bar chart for a glanceable ops comparison strip.


