


Inline stats row
A single ruled band of four tabular figures with short labels, the slimmest way to surface career numbers without a card grid.
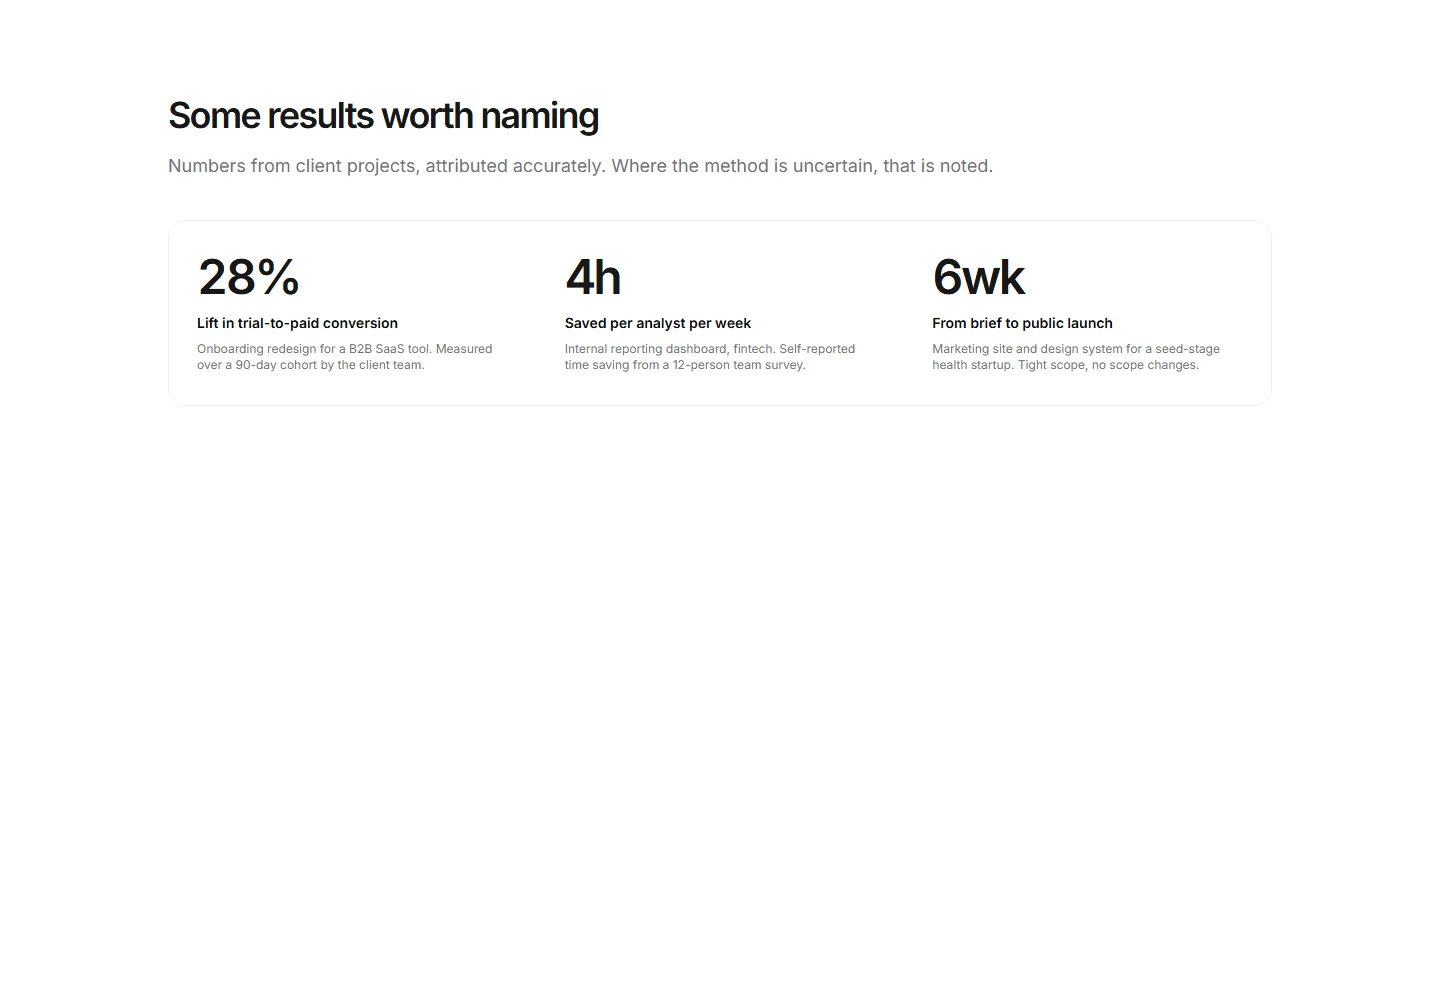
Three outcome figures from real client work, each with an attribution note naming the project type and the measurement method so the result does not overstate.
A single ruled band of four tabular figures with short labels, the slimmest way to surface career numbers without a card grid.
A ruled horizontal band of four headline figures covering years, projects shipped, clients, and a retention count, each with a short plain-English label.
A heading and lede above a bordered card of ruled year rows, each pairing a year with a proportional bar and a project count, plus a total footer.
Three figures each followed by a full sentence naming the client, the quarter, and the measurement method so no result appears without the context that earned it.
Four career figures each paired with a small lucide icon and a label in individual cards, making a numbers strip visually scannable.
A heading and lede above a single segmented distribution bar showing how billed time splits across four kinds of work, with a percentage legend beneath.
A two-column split with a positioning heading on the left and two ruled figures on the right covering years of independent practice and total projects shipped.
Three large figures in equal columns covering apps shipped, years of practice, and industries deep, each paired with a one-line context note that scopes the number.
A 2x2 grid of qualitative fact tiles covering location, focus, availability, and response time so a prospective client has the practical working-with details at a glance.
A three-figure booking facts band showing response time, current lead time, and next opening month alongside a short enquire CTA card.
A heading and lede above ruled rows that pair each metric and its measurement note with a before figure, an arrow, and an after figure.
A three-stat band of oversized tabular-nums figures divided by vertical rules inside a bordered card, anchored by a closing statement.


