


Survey results bars
Ranked survey answers as horizontal shadcn bars with sample size in the footnote.
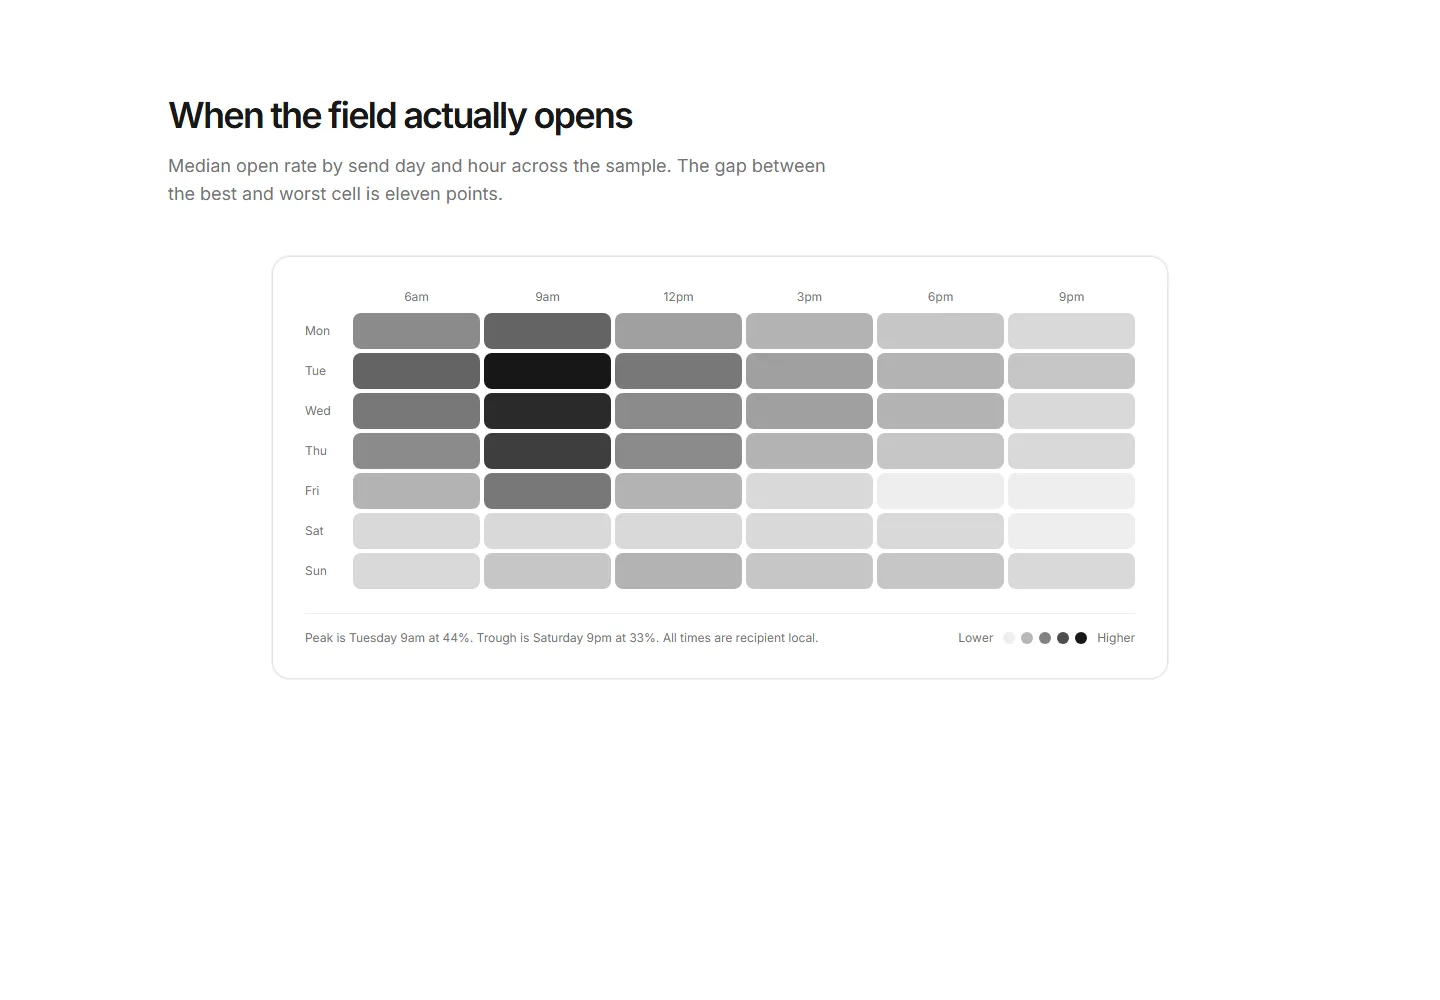
Median open rate by send day and hour as a token opacity heatmap grid, with peak, trough, and a legend.
Ranked survey answers as horizontal shadcn bars with sample size in the footnote.
Reference table listing each headline metric with last year, this year, a signed change chip, and a one line note on what moved it.
Month zero against month three as paired bars, churned teams counted, not survivors.
A report download band trading the itemized PDF for an email.
Benchmark metrics by company size with the reader band highlighted.
Five years of the median and top decile as a shadcn line chart, the case against comparing to stale numbers.
The full account distribution as a shadcn area curve with a marked median.
Median conversion per funnel step as bars with top decile ticks, counting rules per row, and the weakest step named.
Median and top decile open rates by industry as grouped shadcn bars with counting rules.
Executive summary listing numbered findings as divided rows, each pairing a headline stat and label with a title and a two sentence read.
The methods section on the page, sample, definitions, exclusions, and named bias.
Median, quartile, and decile threshold cards with mini position scales and verdict notes.


