


Funnel stat card
Acquisition funnel card with four shrinking horizontal bars, step conversion percentages, and an end-to-end rate headline.
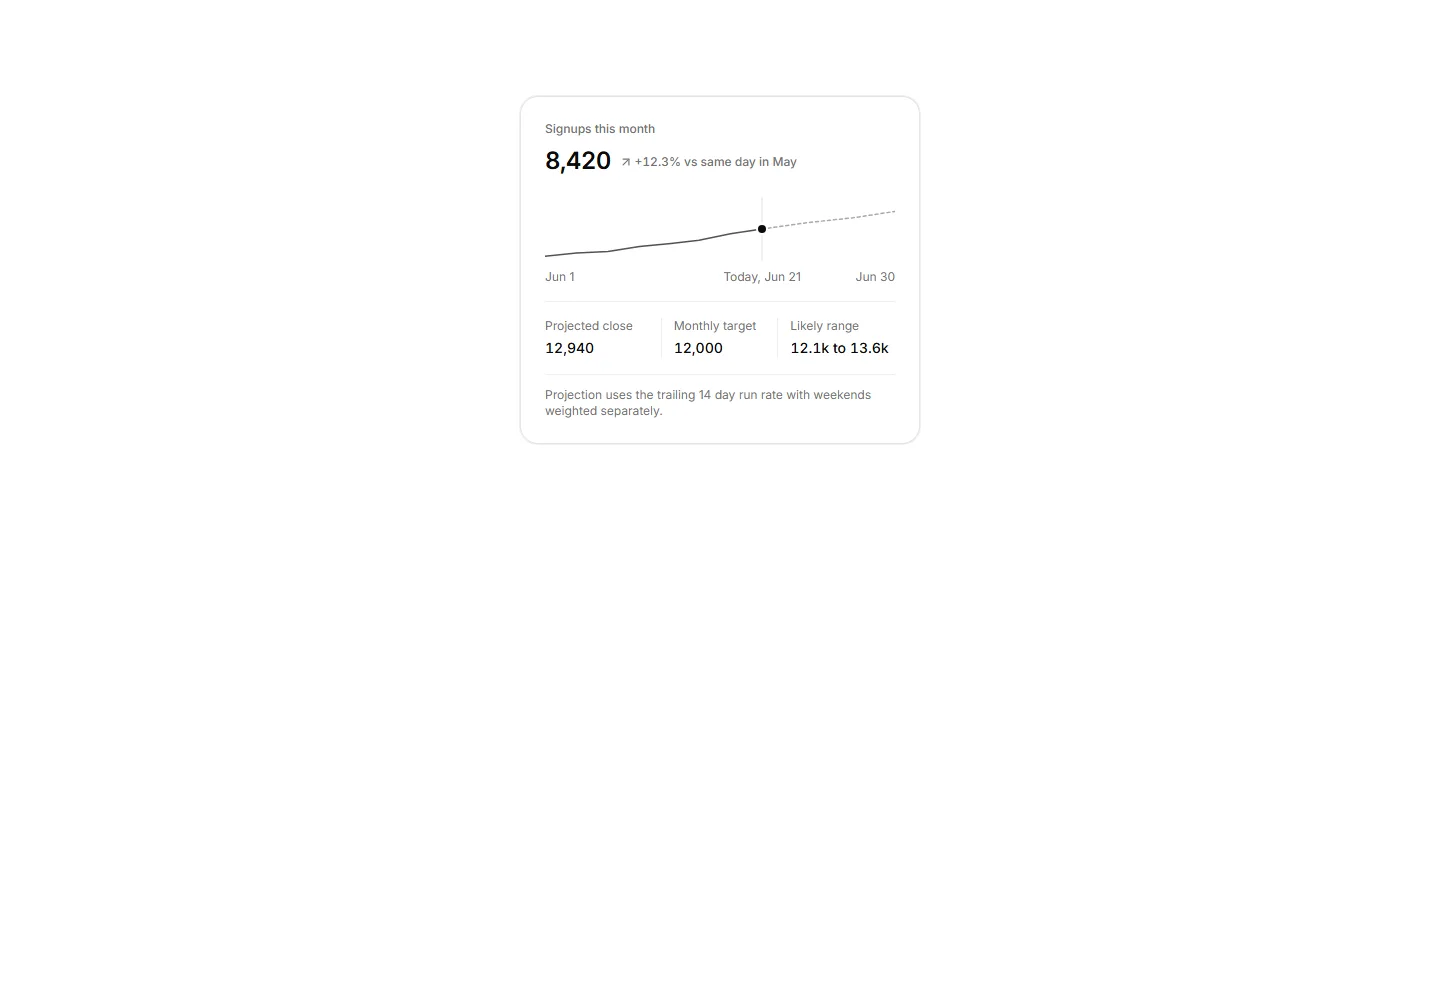
A forecast card with the month to date value, a cumulative line turning dashed past today, and a footer of close, target, and range.
Acquisition funnel card with four shrinking horizontal bars, step conversion percentages, and an end-to-end rate headline.
Three Q2 goal cards each with a progress bar, current vs target value, and a projected pace line.
Activity heatmap card with a CSS grid of cells shaded by foreground opacity across hours and days, no chart lib.
Four headline metrics with deltas and the context line that stops misreadings.
An active user counter with a pulsing dot, a static sparkline, and an honest refresh cadence footnote.
A single metric versus its target on a horizontal progress track with the gap and pace stated plainly.
One card holding three related metrics in a row with vertical dividers, each showing a value, label, and small delta.
One hero metric with a sparkline and a versioned definition against drift.
A latency card with the p95 headline, a distribution track marking each percentile, and a ruled row per percentile with a magnitude bar and value.
Stat card with a centered inline SVG progress ring showing a single percentage, a used of total sub-line, and a plan limit footer row.
A headline total with a stacked horizontal bar and legend showing the breakdown by source or category.
A card with a 2x2 grid of compact metrics each paired with an inline SVG sparkline, no chart library.


