


Report run history
A run history log with a summary strip above a table of runs showing status badges, start times, durations, row counts, and trigger sources.
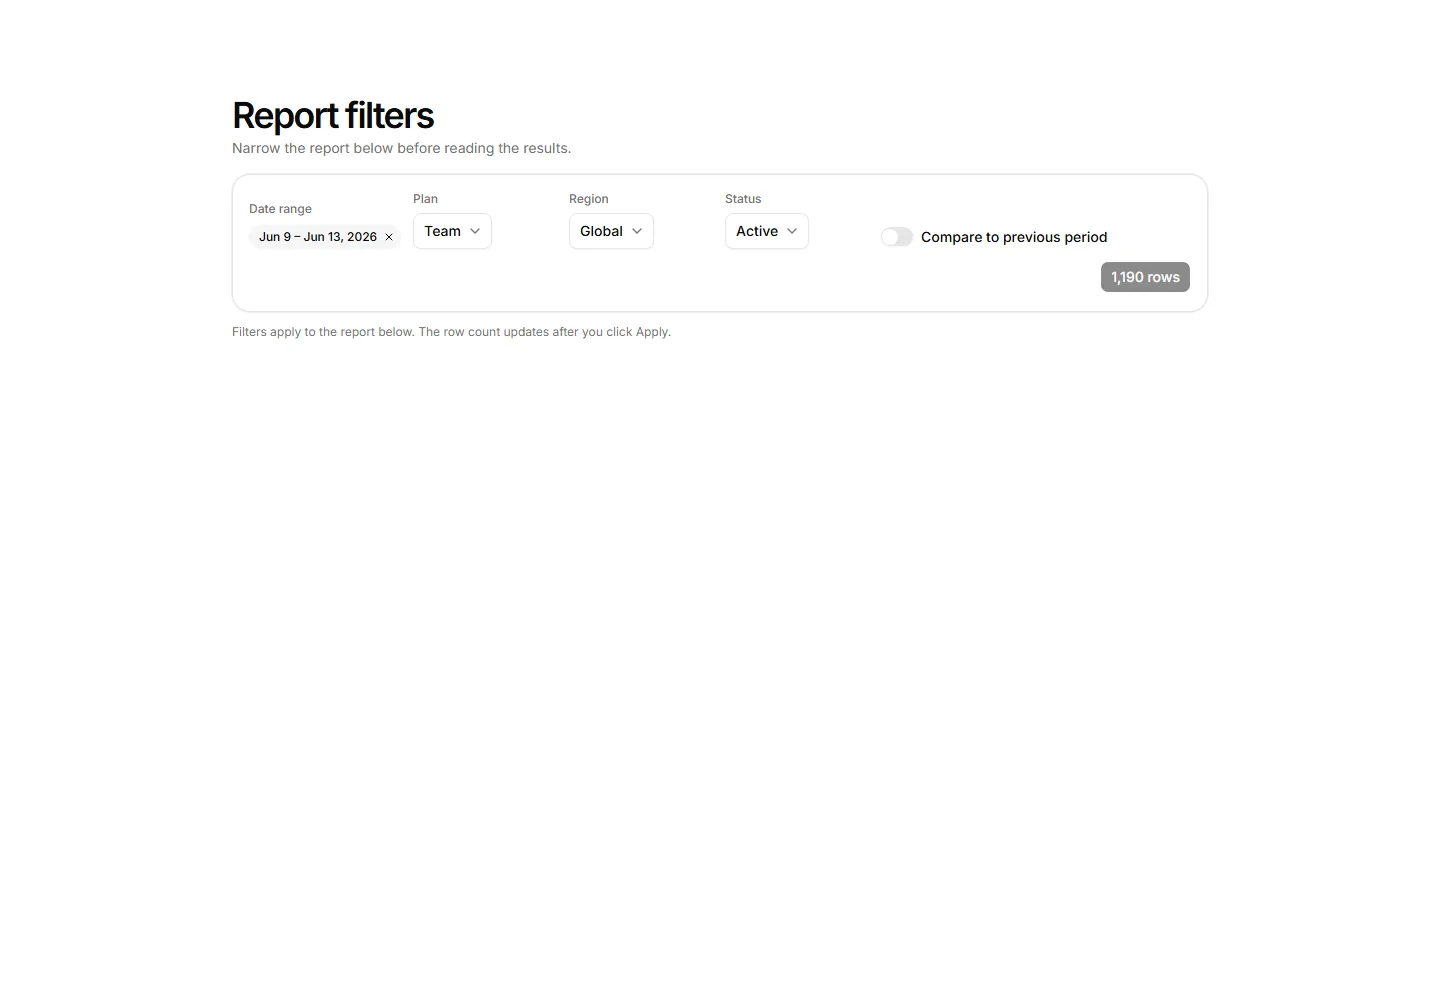
Report filter strip with a removable date-range chip, three dimension selects, a compare to previous period toggle, and an apply button showing the live matching row count.
A run history log with a summary strip above a table of runs showing status badges, start times, durations, row counts, and trigger sources.
Saved report header showing the title, removable filter chips echoing active date range and dimensions, last-refreshed time, and export and share actions.
Table of saved reports with creator, last run time, a schedule chip when scheduled, and per-row run, share, and options actions.
Form to schedule a report delivery with frequency, run time, a tag-style recipient list, format radios, and a no-reply address notice.
Table of workspace delivery schedules with recurrence, recipient avatar stacks, format badges, last sent times, and run or edit actions per row.
A retention heatmap with weekly signup cohorts as rows, weeks since signup as columns, shaded cells, a shade legend, and a methodology note.
Editable dashboard canvas with a KPI tile, bar chart frame, plan revenue list, stat tile, and an add widget affordance.
Export settings card with format radio rows, a current view versus all rows scope choice, a headers toggle, and a button that labels the exact row count and format.
Drill-in view for a KPI click showing a headline metric, period context, and a segment breakdown table with share bars.
An annotated trend chart with numbered markers pinned to dates beside a side rail listing each annotation with author, date, note, and an add control.
Self-serve report panel with metric and dimension selects, a date-range chip, visualization toggle, and a live stub preview area.
A period over period comparison with two period chips, a swap control, a metrics summary line, and a table of current, previous, and change values.


