


Import in progress state
A panel for a running data import with a three step pipeline, a live progress bar, meta rows for timing, and notify or cancel actions.
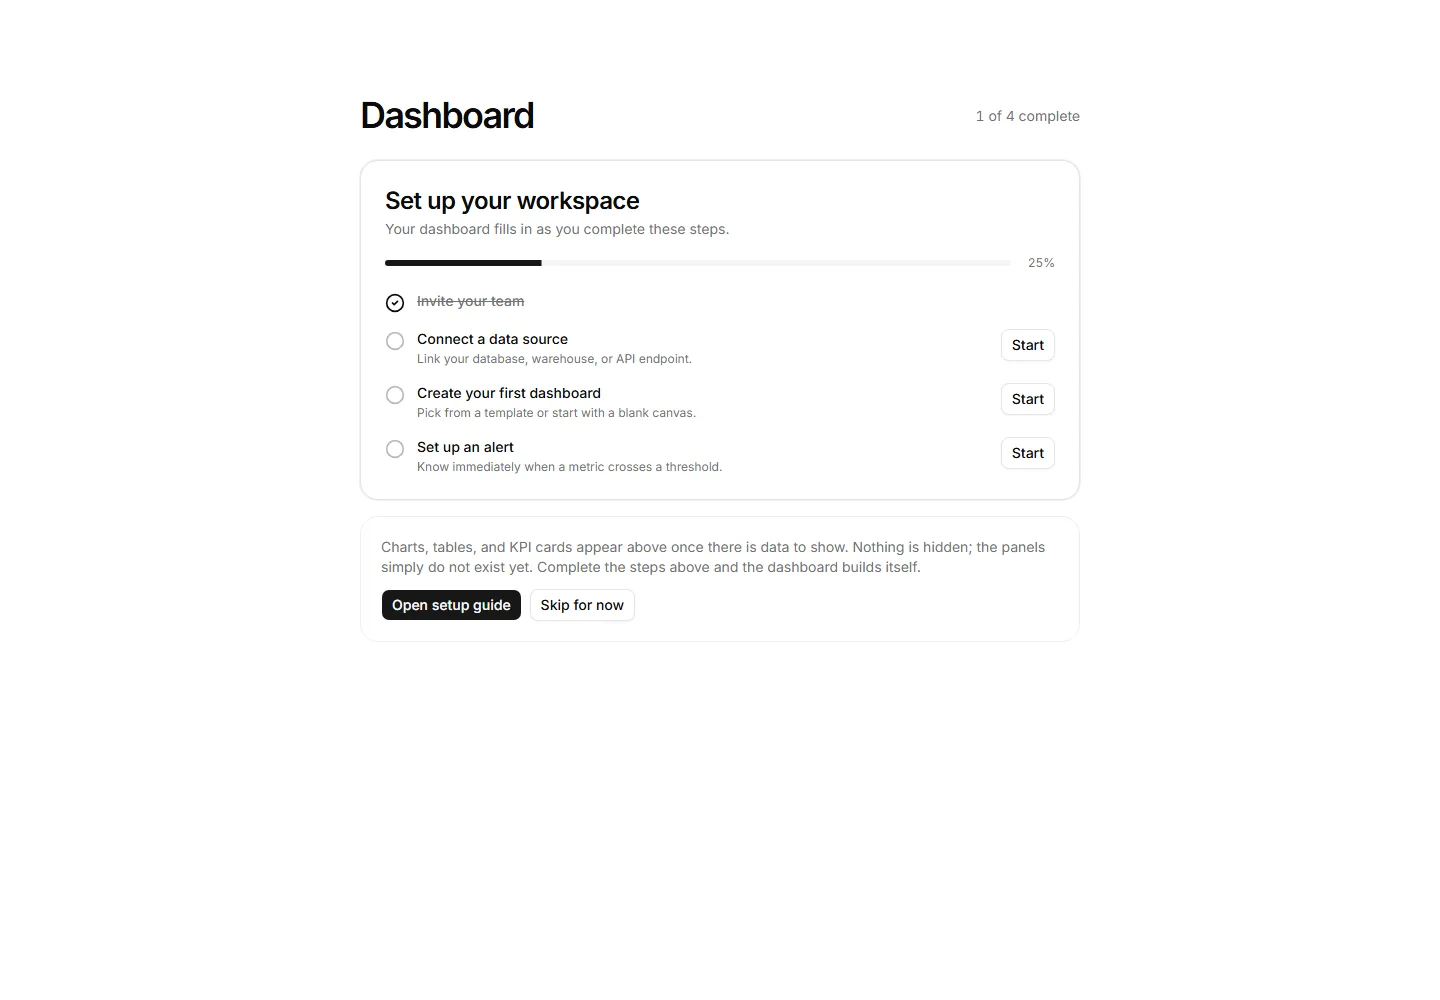
Empty dashboard state with a 4-step setup checklist, progress bar, and honest note that panels appear as steps are completed.
A panel for a running data import with a three step pipeline, a live progress bar, meta rows for timing, and notify or cancel actions.
Full-page planned maintenance screen with a stated window, estimated time remaining, a do-nothing instruction, and a status-page link.
Pending-access gate naming the reviewer with avatar and ETA, plus a list of surfaces the user can reach in the meantime.
Empty panel with a geometric illustration, an events headline, an explanation of when data appears, and a primary API call action.
Empty integrations surface with unlock bullets, a browse CTA, and Slack, GitHub, and Jira quick-connect chips.
The query kept, three scopes to widen, and what search covers stated.
Offline state panel listing what still works locally and what is paused until reconnection, with a guarantee that queued drafts are never lost.
The dashboard before data, zeroed KPIs and the five minute fill promise.
Payment failed billing gate showing the card on file, the exact decline code, a three attempt retry schedule, and update and retry actions.
The 403 that names the role, the owners who grant it, and the request flow.
Rate limit panel showing the 60 requests per minute cap, the reset time, and upgrade or support paths to increase the limit.
Zero-result state echoing 3 active filter chips, the count 0 of 124, and per-filter recovery suggestions with item counts.


