


Reaction activity feed
Social activity feed showing who reacted to or commented on your work, with emoji badges and inline comment quotes.
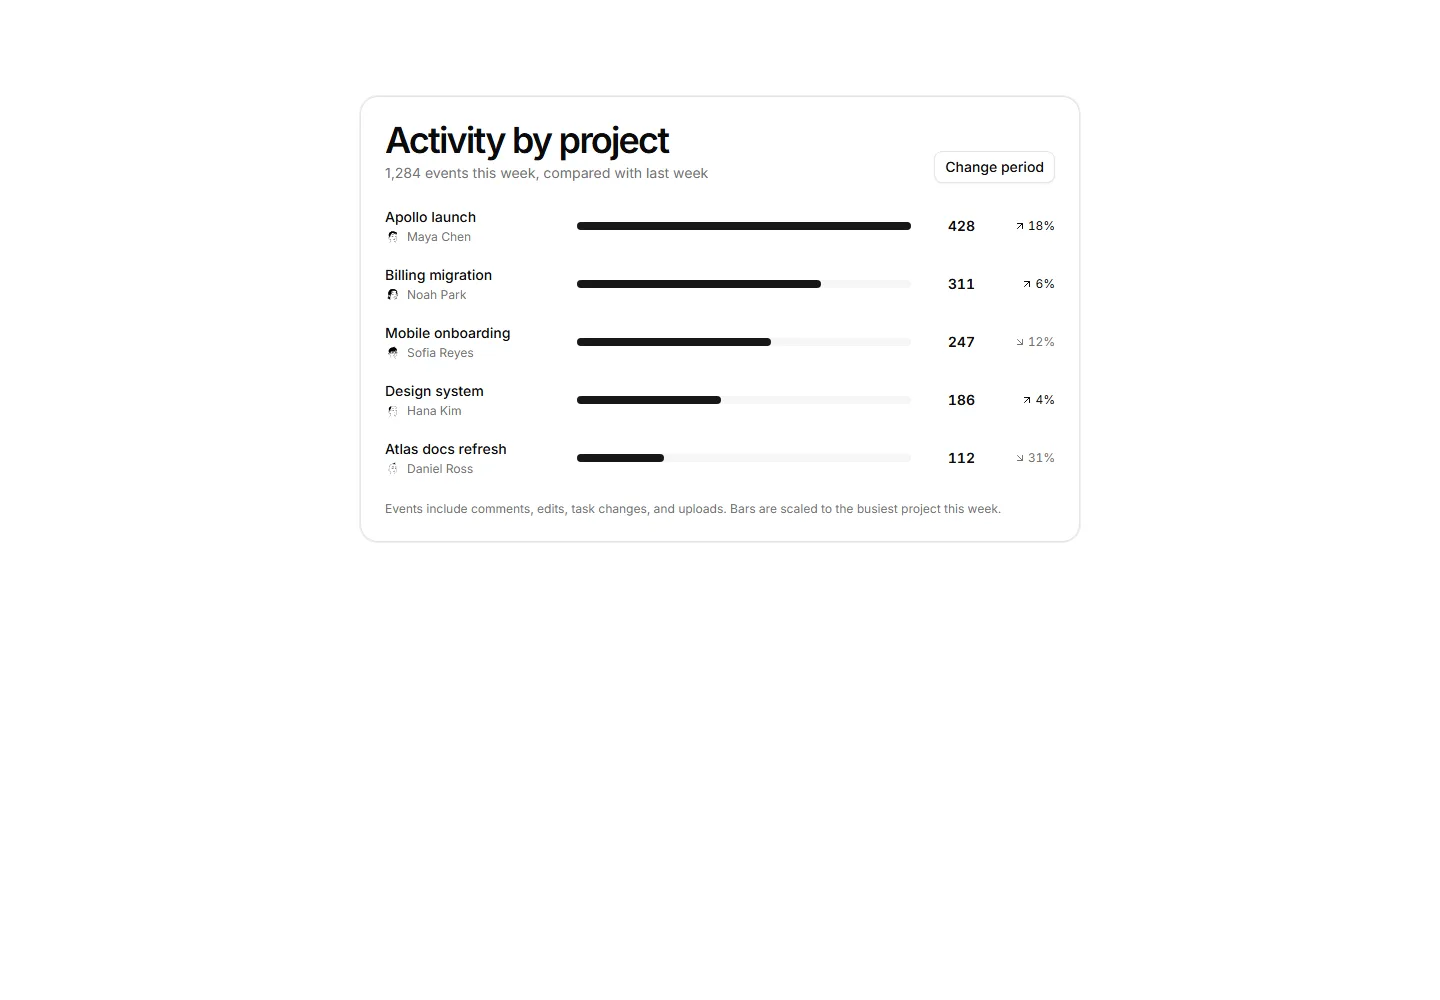
A card ranking projects by weekly activity volume, each row showing the top member, a proportional bar, the event count, and a trend delta.
Social activity feed showing who reacted to or commented on your work, with emoji badges and inline comment quotes.
A card listing recent account sessions, each with a device icon tile, browser and OS, location with IP, timestamp, current session badge, and revoke actions.
Vertical timeline of status transitions for one entity with actor names, timestamps, and time-in-state durations.
Workspace events on a timeline rail with avatars and one expanded comment.
Weekly team activity summary with commit, comment, and task stats, inline sparklines, and a most-active member row.
Named saves with autosaves collapsed, restore always creates, never rewinds.
Workspace activity table with actor avatars, plain-English action verbs, target resources, and result badges.
Month grid calendar with per-day activity dots scaled by event count and a selected-day event list beside it.
Weekday by hour heatmap of workspace events with intensity cells, a Less to More legend, and peak and quiet window callouts.
Pending requests with context and age, approve or deny, expiry told to the asker.
Compliance export form with date range, event count, format selector, and an append-only log disclosure note.
The compliance log grouped by day, mono actions, second precision, source IPs.


